nlcpy.logspace
- nlcpy.logspace(start, stop, num=50, endpoint=True, base=10.0, dtype=None, axis=0)[source]
Returns numbers spaced evenly on a log scale.
In linear space, the sequence starts at
base ** start(base to the power of start) and ends withbase ** stop(see endpoint below).- Parameters
- startarray_like
base ** startis the starting value of the sequence.- stoparray_like
base ** stopis the final value of the sequence, unless endpoint is False. In that case,num + 1values are spaced over the interval in log-space, of which all but the last (a sequence of length num) are returned.- numint, optional
Number of samples to generate. Default is 50.
- endpointbool, optional
If true, stop is the last sample. Otherwise, it is not included. Default is True.
- basefloat, optional
The base of the log space. The step size between the elements in
ln(samples) / ln(base)(orlog_base(samples)) is uniform. Default is 10.0.- dtypedtype, optional
The type of the output array. If dtype is not given, infer the data type from the other input arguments.
- axisint, optional
The axis in the result to store the samples. Relevant only if start or stop are array-like. By default (0), the samples will be along a new axis inserted at the beginning. Use -1 to get an axis at the end.
- Returns
- samplesndarray
num samples, equally spaced on a log scale.
See also
Note
Logspace is equivalent to the code
>>> import nlcpy as vp
>>> y = vp.linspace(start, stop, num=num, endpoint=endpoint)
...
>>> vp.power(base, y).astype(dtype)
...
Examples
>>> import nlcpy as vp
>>> vp.logspace(2.0, 3.0, num=4)
array([ 100.        ,  215.443469  ,  464.15888336, 1000.        ])
>>> vp.logspace(2.0, 3.0, num=4, endpoint=False)
array([100.        , 177.827941  , 316.22776602, 562.34132519])
>>> vp.logspace(2.0, 3.0, num=4, base=2.0)
array([4.        , 5.0396842 , 6.34960421, 8.        ])
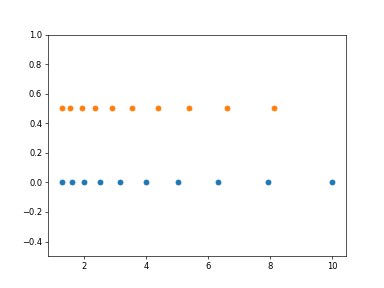
Graphical illustration:
>>> import matplotlib.pyplot as plt
>>> N = 10
>>> x1 = vp.logspace(0.1, 1, N, endpoint=True)
>>> x2 = vp.logspace(0.1, 1, N, endpoint=False)
>>> y = vp.zeros(N)
>>> plt.plot(x1, y, 'o')
>>> plt.plot(x2, y + 0.5, 'o')
>>> plt.ylim([-0.5, 1])
(-0.5, 1.0)
>>> plt.show()