nlcpy.random.RandomState.weibull
- RandomState.weibull(self, a, size=None)
Draws samples from a Weibull distribution.
Draws samples from a 1-parameter Weibull distribution with the given shape parameter a.

Here, U is drawn from the uniform distribution over
(0,1]. The more common 2-parameter Weibull, including a scale parameter is just
- Parameters
- afloat
Shape parameter of the distribution. Must be nonnegative.
- sizeint or tuple of ints, optional
Output shape. If the given shape is, e.g.,
(m, n, k), thenm * n * ksamples are drawn.
- Returns
- outndarray
Drawn samples from the parameterized Weibull distribution.
参考
RandomState.gumbelDraws samples from a Gumbel distribution.
注釈
The probability density for the Weibull distribution is

where
 is the shape and the scale.
The function has its peak (the mode) at
 .
.When
a = 1, the Weibull distribution reduces to the exponential distribution.制限事項
If a is neither a scalar nor None : NotImplementedError occurs.
Examples
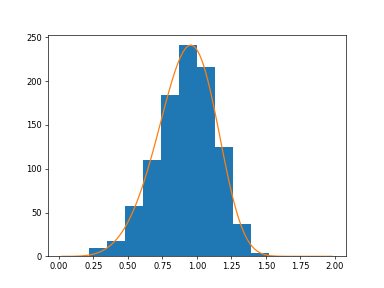
Draw samples from the distribution:
>>> import nlcpy as vp
>>> a = 5. # shape
>>> s = vp.random.weibull(a, 1000)
Display the histogram of the samples, along with the probability density function:
>>> import matplotlib.pyplot as plt
>>> x = vp.arange(1,100.)/50.
>>> def weib(x,n,a):
...     return (a / n) * (x / n)**(a - 1) * vp.exp(-(x / n)**a)
>>> count, bins, ignored = plt.hist(s.get())
>>> x = vp.arange(1,100.)/50.
>>> scale = count.max()/weib(x, 1., 5.).max()
>>> plt.plot(x, weib(x, 1., 5.)*scale)
>>> plt.show()