Example: Clustering
Objective
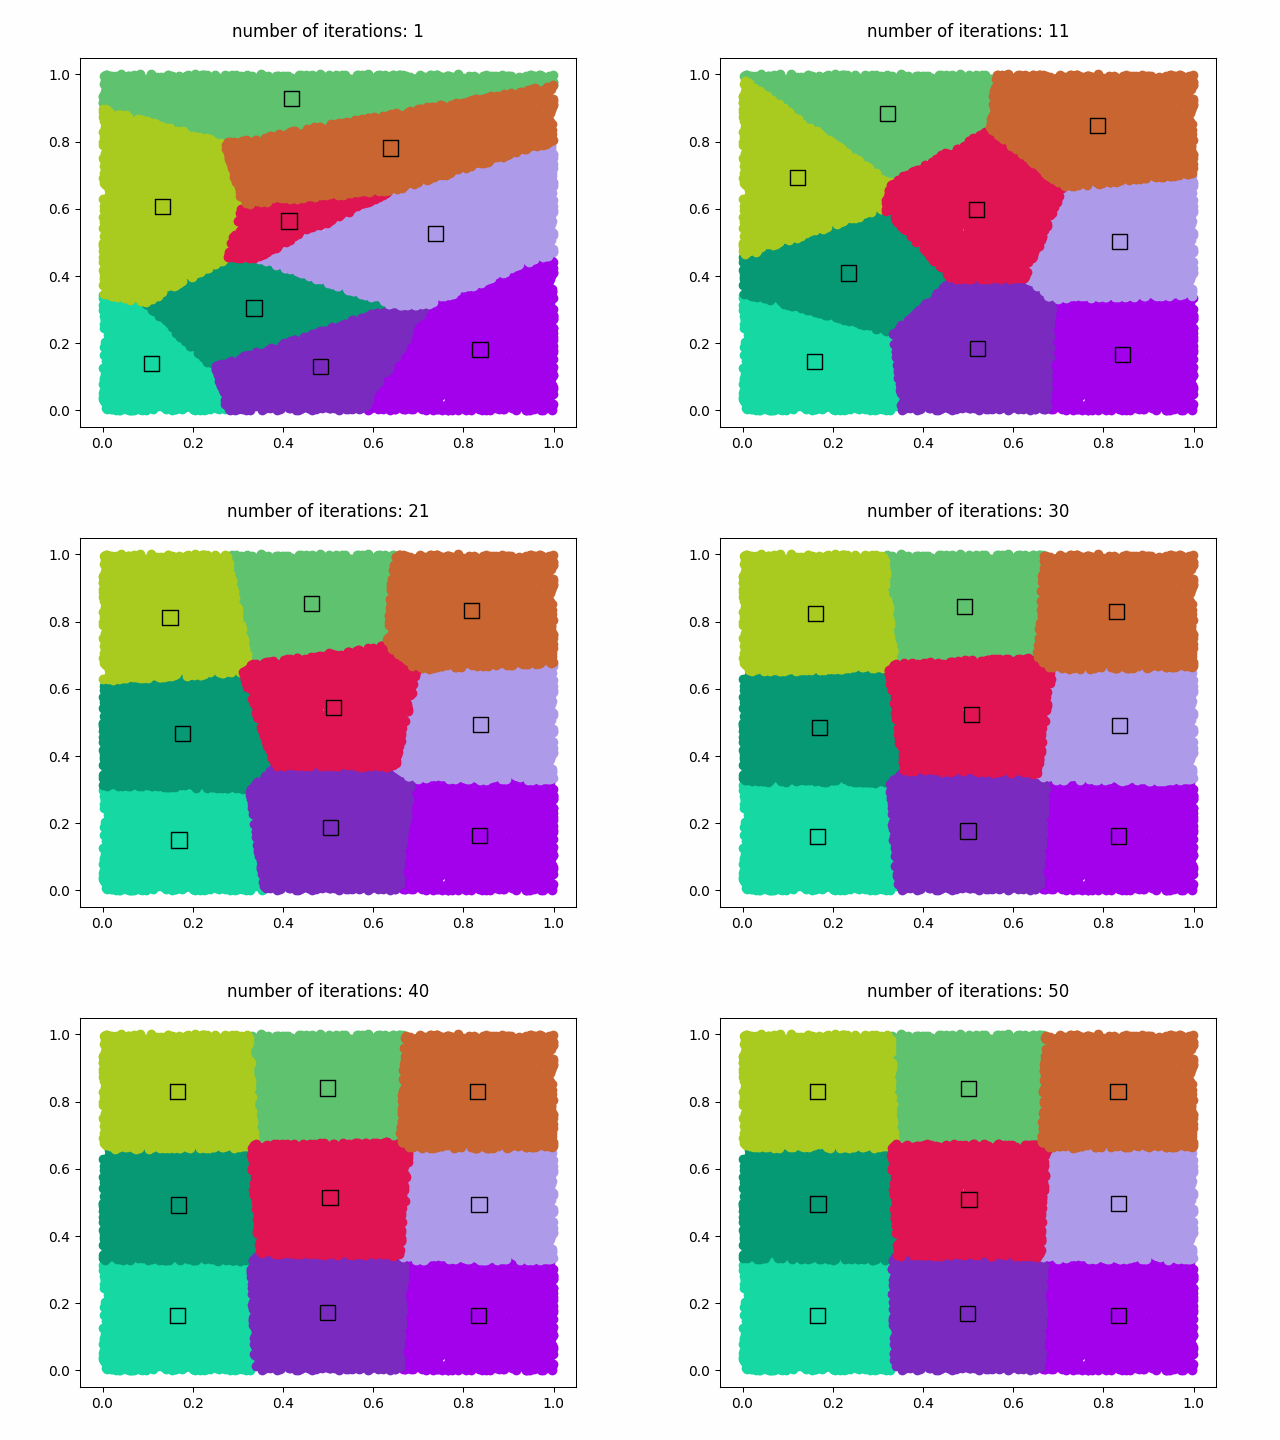
We will classify 1,000,000 datasets into 9 clusters by using k-means algorithm. The number of iteration steps for k-means is 50. After 50 iteration steps are computed, the GIF animation is saved as ‘clustering.gif’.
Program
import nlcpy as vp
from matplotlib import pyplot as plt
from matplotlib import animation

N_SAMPLES  = 1000000  # The number of samples
N_CLUSTERS =       9  # The number of clusters
MAX_ITER   =      50  # The number of maximum iterations
N_DRAW     =   20000  # The number of samples for drawing


def draw(s, c, l, it):
    # Plot the samples and centroids of the fitted clusters into an image file.
    vp.random.seed(777)
    colors = vp.random.rand(N_CLUSTERS, 3).get()
    ind = vp.random.randint(0, N_SAMPLES, N_DRAW)
    s = s[ind]
    l = l[ind]
    ims = []
    im = plt.text(.5, 1.1, 'number of iterations: {}'.format(it + 1),
                  ha='center', va='bottom', fontsize='large')
    ims.append(im)
    for i in range(N_CLUSTERS):
        labels = s[l == i, :]
        im = plt.scatter(labels[:, 0], labels[:, 1], color=colors[i, :])
        ims.append(im)
    im = plt.scatter(
            c[:, 0], c[:, 1], s=120, marker='s', facecolors=colors,
            edgecolors='k')
    ims.append(im)
    return ims

def kmeans():
    vp.random.seed(111)
    s = vp.random.rand(N_SAMPLES, 2)
    ind = vp.random.randint(0, N_SAMPLES, N_CLUSTERS)
    c = s[ind]  # Initial centroids
    label = vp.zeros(N_SAMPLES)

    fig = plt.figure()
    ims = []
    for i in range(MAX_ITER):
        # Estimate the distance and label for each sample
        d = vp.linalg.norm(s[None, :, :] - c[:, None, :], axis=2)
        label_new = vp.argmin(d, axis=0)
        if vp.all(label == label_new):
            break
        label = label_new

        # Compute the new centroid for each cluster
        mask = (label == vp.arange(N_CLUSTERS)[:, None])
        sums = vp.where(mask[:, None, :], s.T, 0).sum(axis=2)
        counts = mask.sum(axis=1).reshape((N_CLUSTERS, 1))
        c = sums / counts

        ims.append(draw(s, c, label, i))

    ani = animation.ArtistAnimation(fig, ims, interval=200, blit=True)
    ani.save("clustering.gif", writer='pillow')


if __name__ == '__main__':
    assert N_SAMPLES >= N_CLUSTERS
    assert N_SAMPLES >= N_DRAW
    kmeans()
Result
This is the GIF animiation (clustering.gif).

Copyrights
- This example is based on the following code:
https://github.com/cupy/cupy/blob/master/examples/kmeans/kmeans.py
See also