nlcpy.random.RandomState.gumbel
- RandomState.gumbel(self, loc=0.0, scale=1.0, size=None)
Draws samples from a Gumbel distribution.
Draws samples from a Gumbel distribution with specified location and scale. For more information on the Gumbel distribution, see Notes and References below.
- Parameters
- locfloat, optional
The location of the mode of the distribution. Default is 0.
- scalefloat, optional
The scale parameter of the distribution. Default is 1. Must be non-negative.
- sizeint or tuple of ints, optional
Output shape. If the given shape is, e.g.,
(m, n, k), thenm * n * ksamples are drawn.
- Returns
- outndarray
Drawn samples from the parameterized Gumbel distribution.
See also
RandomState.weibullDraws samples from a Weibull distribution.
Note
The probability density for the Gumbel distribution is

where
 is the mode, a location parameter, and
  is the
scale parameter.
is the
scale parameter.The function has a mean of
 and a variance of
 .
.Restriction
If loc is neither a scalar nor None : NotImplementedError occurs.
If scale is neither a scalar nor None : NotImplementedError occurs.
Examples
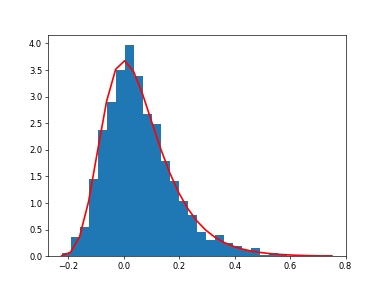
Draw samples from the distribution:
>>> import nlcpy as vp
>>> mu, beta = 0, 0.1 # location and scale
>>> s = vp.random.gumbel(mu, beta, 1000)
Display the histogram of the samples, along with the probability density function:
>>> import matplotlib.pyplot as plt
>>> count, bins, ignored = plt.hist(s.get(), 30, density=True)
>>> plt.plot(bins, (1/beta)*vp.exp(-(bins - mu)/beta)*
... vp.exp( -vp.exp( -(bins - mu) /beta) ),
... linewidth=2, color='r')
>>> plt.show()