Example: Thermal Simulation (Naive Implementation)
Objective
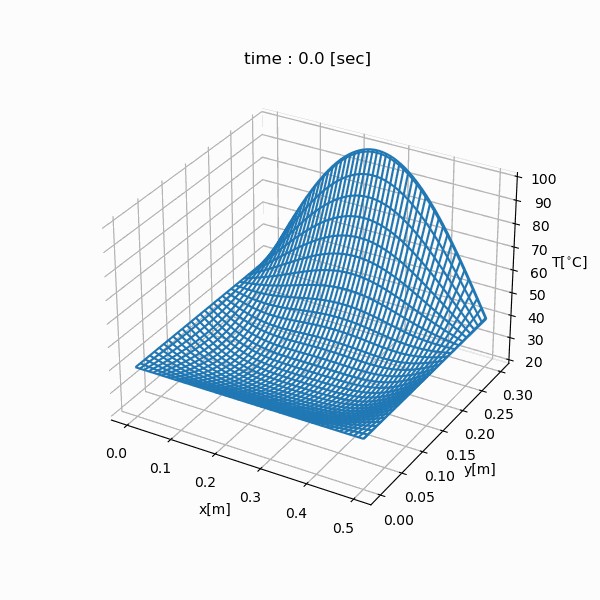
We will simulate the temporal change in temperature of the copper rectangle whose length is 50 cm (= LX), width is 30 cm (= LY) using a finite-difference method.
Physics
Governing Equation

Variable |
Description |
|---|---|
|
Temperature [K] |
|
Time [s] |
|
x coordinate [m] |
|
y coordinate [m] |


Constant |
Description |
Value of Copper |
|---|---|---|
|
Thermal conductivity |
398.0 [W/m K] |
|
Density |
8960.0 [kg/m 3] |
|
Specific heat capacity |
385.0 [J/kg K] |


Boundary Conditions

Initial Conditions

Program
import nlcpy as vp
from matplotlib import pyplot as plt
from matplotlib import animation

LX = 50e-2
LY = 30e-2
T0 = 20.0
T1 = 40.0
T2 = 60.0
HC = 398.0 / (8960.0 * 385.0)
WFRAME = None
DT = 'float32'


def initialize(grid):
    grid.fill(T0)
    grid[:, 0] = T1
    grid[:, -1] = T1
    grid[0] = T1
    grid[-1] = T1 + T2 * \
        vp.sin(vp.pi * vp.linspace(0, LX, grid.shape[1]) / LX)


def compute(grid, coef, temp):
    vp.multiply(grid[1:-1, 1:-1], coef[2], out=temp)
    temp += grid[1:-1, :-2] * coef[0]
    temp += grid[1:-1, 2:] * coef[0]
    temp += grid[2:, 1:-1] * coef[1]
    temp += grid[:-2, 1:-1] * coef[1]
    grid[1:-1, 1:-1] = temp[...]


def heatequation(
        nx,  # The number of grid points in X-direction.
        ny,  # The number of grid points in Y-direction.
        dt,  # The time step interval.
        mt,  # The maximum number of time steps.
        kp,  # The number of time steps for drawing interval.
):
    mx = nx + 2
    my = ny + 2
    grid = vp.empty((my, mx), dtype=DT)
    temp = vp.empty((ny, nx), dtype=DT)

    dx = LX / (nx + 1)
    dy = LY / (ny + 1)

    coef = [
        (HC * dt) / (dx * dx),
        (HC * dt) / (dy * dy),
        1.0 - HC * dt * (2.0 / (dx * dx) + 2.0 / (dy * dy)),
    ]

    x = vp.linspace(0, LX, mx)
    y = vp.linspace(0, LY, my)
    xx, yy = vp.meshgrid(x, y)

    print("initializing grid...", end="", flush=True)
    initialize(grid)
    print("done", flush=True)

    grid_for_plot = [grid, ]
    fig = plt.figure(figsize=(6, 6))
    ax = fig.add_subplot(111, projection='3d')
    print("computing difference method...", end="", flush=True)
    for i in range(int(mt/dt)):
        compute(grid, coef, temp)
        if i % int(kp/dt) == 0:
            grid_for_plot.append(grid.get())
    print("done", flush=True)

    def animate(i):
        global WFRAME
        if WFRAME:
            ax.collections.remove(WFRAME)
        WFRAME = ax.plot_wireframe(
            xx, yy, grid_for_plot[i], rstride=10, cstride=10)
        ax.set_title('time : {:2.1f} [sec]'.format(i * kp))

    def animate_init():
        ax.set_xlabel("x[m]")
        ax.set_ylabel("y[m]")
        ax.set_zlabel("T[$^{\circ}$C]")
        ax.zaxis.set_rotate_label(False)
        ax.set_zlim(T0, T1 + T2)

    print("creating animation...", end="", flush=True)
    animation.FuncAnimation(
        fig,
        animate,
        interval=200,
        frames=int(mt / kp + 1),
        repeat=False,
        init_func=animate_init
    ).save(
        "thermal_simulation.gif",
        writer='pillow'
    )
    print("done", flush=True)


if __name__ == "__main__":
    heatequation(500, 300, 0.001, 30, 1.)
Simulation Result