サンプル: クラスタリング
目的
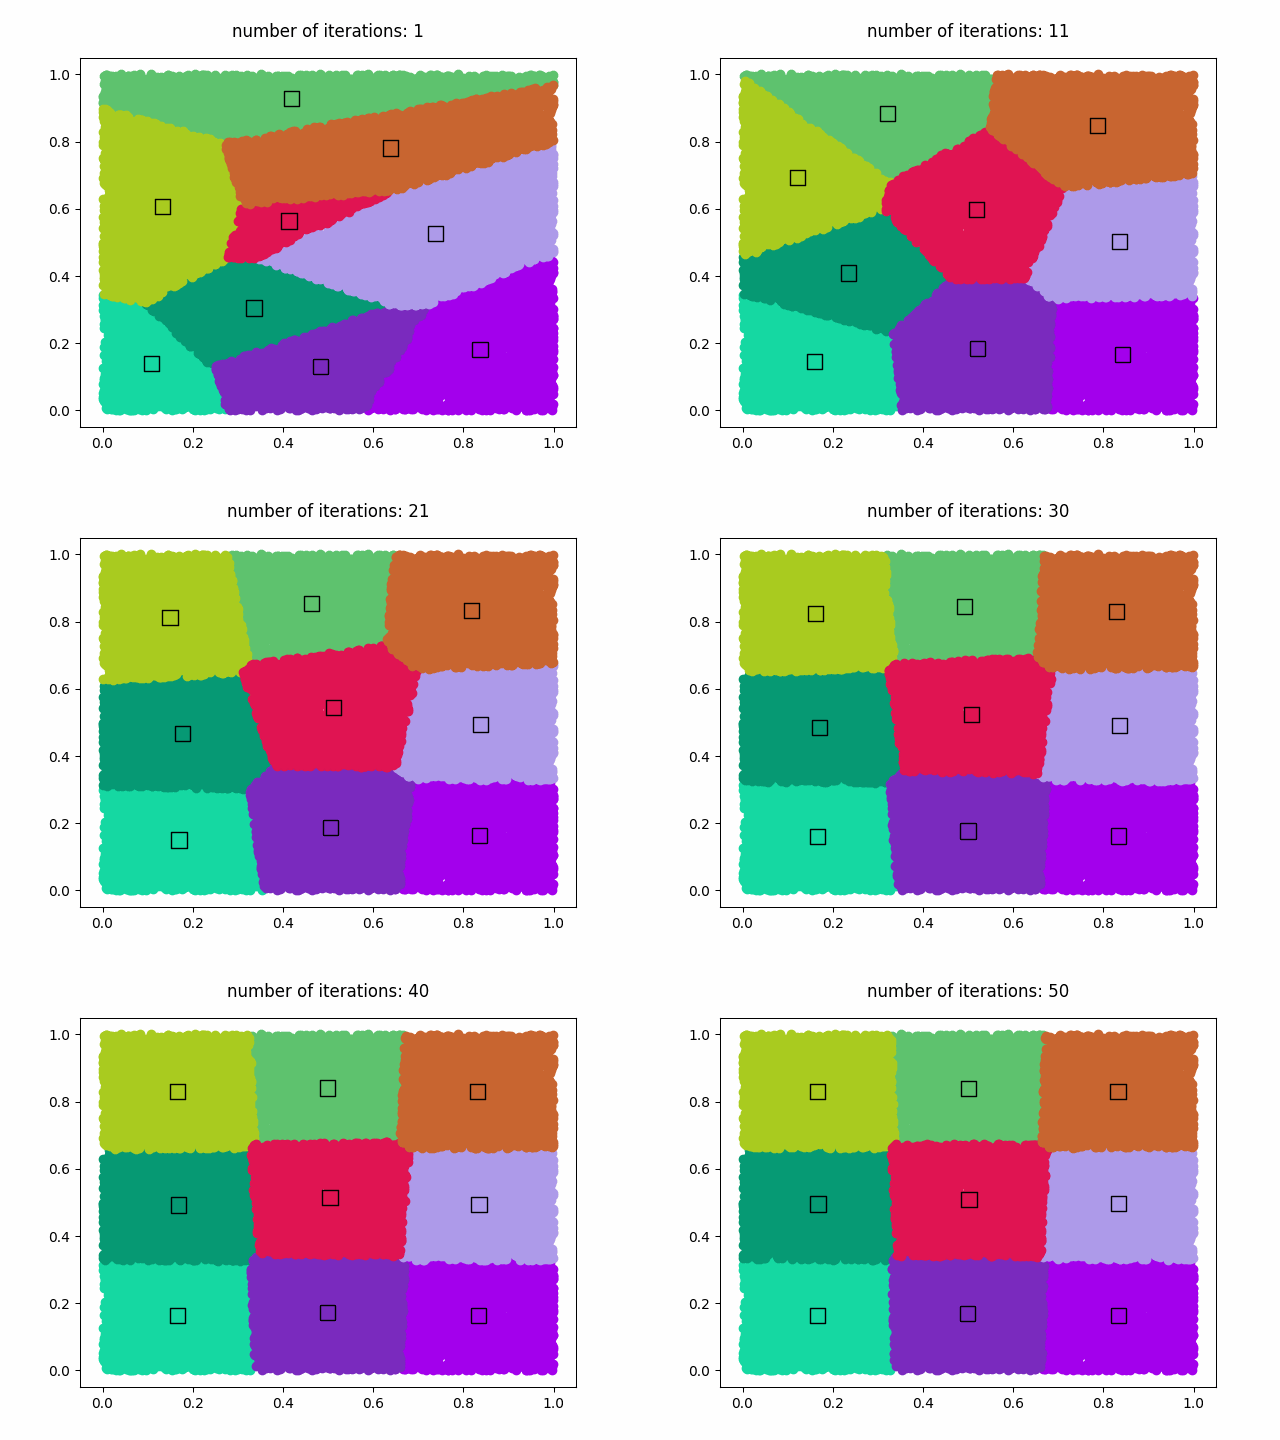
k-meansアルゴリズムを使用して、1,000,000個のデータセットを9個のクラスタに分類します。k-meansの反復回数は50回です。50回の反復計算後、GIFアニメーションが'clustering.gif'に保存されます。
プログラム
import nlcpy as vp
from matplotlib import pyplot as plt
from matplotlib import animation

N_SAMPLES  = 1000000  # The number of samples
N_CLUSTERS =       9  # The number of clusters
MAX_ITER   =      50  # The number of maximum iterations
N_DRAW     =   20000  # The number of samples for drawing


def draw(s, c, l, it):
    # Plot the samples and centroids of the fitted clusters into an image file.
    vp.random.seed(777)
    colors = vp.random.rand(N_CLUSTERS, 3).get()
    ind = vp.random.randint(0, N_SAMPLES, N_DRAW)
    s = s[ind]
    l = l[ind]
    ims = []
    im = plt.text(.5, 1.1, 'number of iterations: {}'.format(it + 1),
                  ha='center', va='bottom', fontsize='large')
    ims.append(im)
    for i in range(N_CLUSTERS):
        labels = s[l == i, :]
        im = plt.scatter(labels[:, 0], labels[:, 1], color=colors[i, :])
        ims.append(im)
    im = plt.scatter(
            c[:, 0], c[:, 1], s=120, marker='s', facecolors=colors,
            edgecolors='k')
    ims.append(im)
    return ims

def kmeans():
    vp.random.seed(111)
    s = vp.random.rand(N_SAMPLES, 2)
    ind = vp.random.randint(0, N_SAMPLES, N_CLUSTERS)
    c = s[ind]  # Initial centroids
    label = vp.zeros(N_SAMPLES)

    fig = plt.figure()
    ims = []
    for i in range(MAX_ITER):
        # Estimate the distance and label for each sample
        d = vp.linalg.norm(s[None, :, :] - c[:, None, :], axis=2)
        label_new = vp.argmin(d, axis=0)
        if vp.all(label == label_new):
            break
        label = label_new

        # Compute the new centroid for each cluster
        mask = (label == vp.arange(N_CLUSTERS)[:, None])
        sums = vp.where(mask[:, None, :], s.T, 0).sum(axis=2)
        counts = mask.sum(axis=1).reshape((N_CLUSTERS, 1))
        c = sums / counts

        ims.append(draw(s, c, label, i))

    ani = animation.ArtistAnimation(fig, ims, interval=200, blit=True)
    ani.save("clustering.gif", writer='pillow')


if __name__ == '__main__':
    assert N_SAMPLES >= N_CLUSTERS
    assert N_SAMPLES >= N_DRAW
    kmeans()
結果
GIFアニメーション (clustering.gif)

著作権
- このサンプルは以下のコードをベースにしています。
https://github.com/cupy/cupy/blob/master/examples/kmeans/kmeans.py
参考